 See it on dometrain
 See it on dometrain
 See it on dometrain
 See it on Amazon
A Queue Is a Shock Absorber, Not a Pump

⏱ 8 min read
The queue was never the thing that needed protecting.
Imagine this scenario. A bulk of 40,000 messages lands at 9:00, you scale out and add competing consumers, and by 9:12 queue depth is back to zero. Green everywhere. Success! But there is a different side to this story.
The database has been returning errors for ten minutes. Orders that sat safely in the queue at 9:00 are now in the dead-letter queue, the retry policy limit is exhausted now, and the on-call engineer is staring at Azure SQL error 10928: The request limit for the database is 120 and has been reached.
Nothing broke in the messaging layer. It did exactly what we asked, and we asked for the wrong thing.
Competing consumers and a queue for load leveling almost always ship together. The first is about throughput: you add consumers, and with autoscaling the instance count follows message volume. The second is about protection: the queue absorbs the spike so the database behind it doesn't have to.
When you put them together sometimes the second promise quietly breaks. Let's disect this a little bit. A queue levels load because consumers work at their own pace. When you autoscale based on queue depth, the pace becomes "as fast as the backlog demands." At that point the queue stops being a buffer. It becomes a very efficient way to move the spike to your database.
The standard Azure setup shows it well: Azure Functions between a Service Bus queue and a data store. Unless you tune scale limits and trigger concurrency, the worker layer brings the contention right back to the database. Neither default knows anything about your database. Again, autoscaling that doesn't bound the combined rate of all consumers only moves the overload to whatever sits downstream.
Every consumer platform gives you two numbers: how many instances run, and how many messages each instance handles at once. Your database sees the product.
Instances x concurrency per instance = concurrent database work.
Take an Azure Functions app with a Service Bus trigger and default settings. maxConcurrentCalls in host.json defaults to 16 per instance. The docs add a detail that's easy to miss: on hardware with more than one core, that number is multiplied by the core count. Scale out to 20 instances and you have 320 handlers, or 640 on two cores, each able to open a transaction at the same moment.
Now the other side. A Standard S2 Azure SQL database allows 120 concurrent workers. An S3 allows 200. Past that limit, Azure SQL rejects new requests with error 10928. The message still says "request limit" for backward compatibility, but what ran out is workers. A parallel query plan uses more than one worker, so you can hit the ceiling with fewer requests than you'd expect. Cosmos DB tells the same story in different words: exceed your provisioned RU/s and you get 429s.
Your connection pool won't save you either. SqlClient's Max Pool Size defaults to 100, but that's per process. Twenty instances means twenty pools and up to 2,000 connections. The pool limits each instance. Nothing limits the fleet.
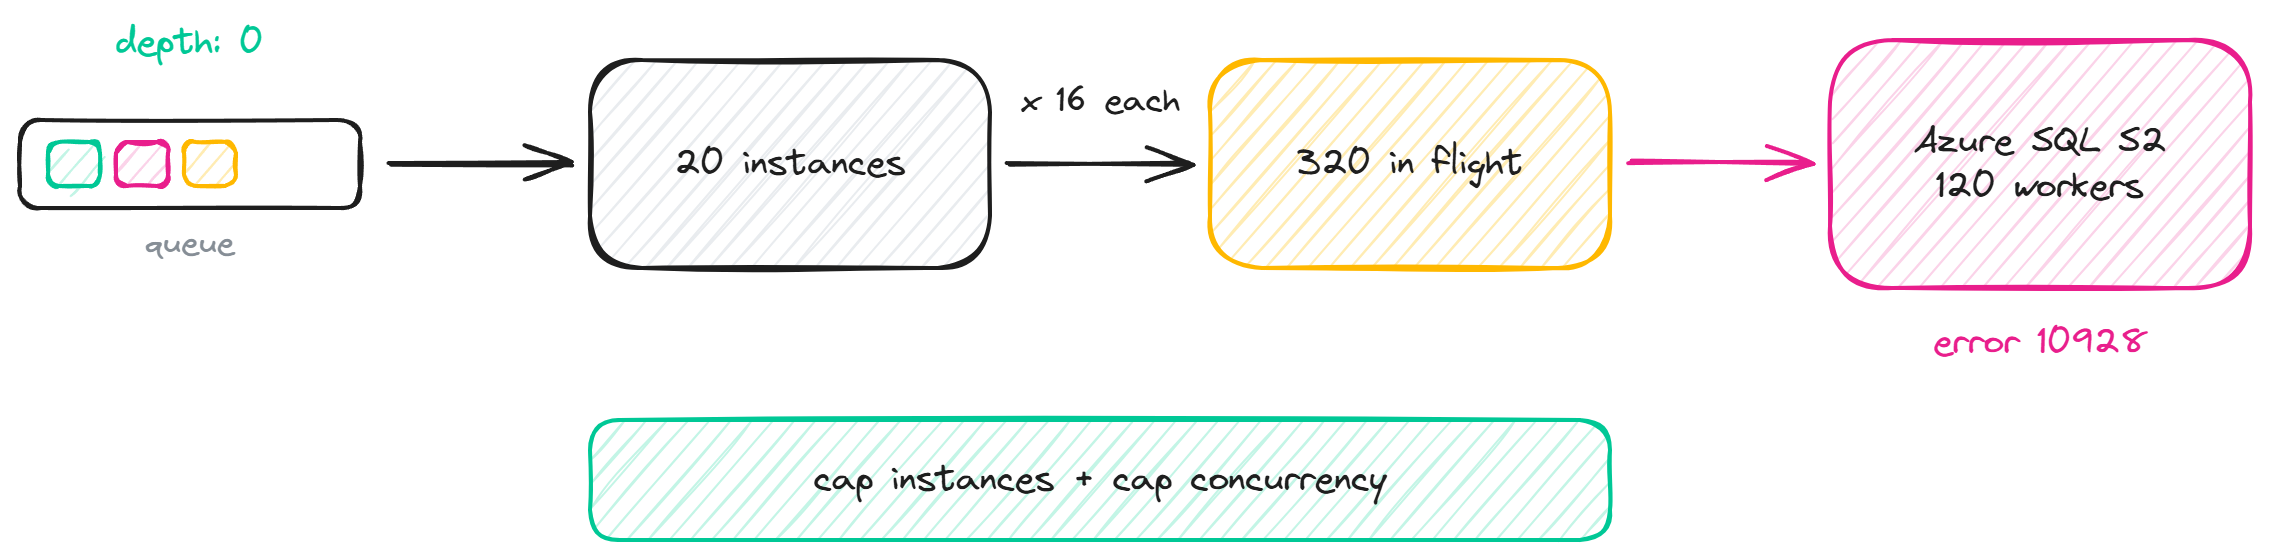
No page in the docs says this outright. It falls out of the math.
Azure Functions scales Service Bus triggers with target-based scaling, and the documented formula is simple: desired instances = queue length / target executions per instance. For a single-dispatch Service Bus trigger, target executions per instance is maxConcurrentCalls.
Now follow the formula through. You see the database struggling and drop maxConcurrentCalls from 16 to 4 to ease the pressure. With 320 messages waiting, the formula asked for 20 instances before the change. After it, the formula asks for 80. Each instance does less, so the platform wants four times as many: 20 x 16 and 80 x 4 are both 320 messages in flight. Unless an instance cap stops it, the load on your database doesn't change.
Container Apps behaves the same way. KEDA computes desiredReplicas = ceil(queueLength / messageCount), bounded only by maxReplicas. A smaller messageCount means more replicas.
The per-instance limit and the instance cap only protect the database together. Either one alone is a suggestion.
NServiceBus and MassTransit have the same trap without the scaler. LimitMessageProcessingConcurrencyTo applies per endpoint instance, and the Particular docs spell it out: three instances with a limit of 4 means 12. MassTransit's docs say ConcurrentMessageLimit at bus level "provides a default for each endpoint, not a shared limit across the bus." Every limit you set is local. The database on the other hand only cares about the global one.
An overloaded database rarely fails cleanly. Queries slow down, lock waits grow, and handlers start timing out.
Then the retries start, and there are more layers of them than most teams count. The Cosmos DB .NET SDK retries a 429 up to 9 times by default before your code sees an exception. If the handler still fails, the Functions runtime abandons the message and Service Bus redelivers it, up to MaxDeliveryCount, which defaults to 10. In the worst case, a message that makes one Cosmos DB call becomes 100 requests against a database that was already saying no.
After the tenth failed delivery, a perfectly valid message moves to the dead-letter queue with reason MaxDeliveryCountExceeded. Nothing was wrong with it. It just arrived during the wrong five minutes. Your DLQ alert, the one I told you to set up, now fires for thousands of healthy orders, and someone has to replay them after the database recovers.
That's what makes incidents like these expensive. Queue depth at zero looked like success. In reality the backlog moved from the one place built to hold it, the broker, into two places that weren't: the database and the DLQ.
Competing consumers cost you a few more things.
You can live with all three, as long as you choose them on purpose.
Start from the database and work backwards. Decide how much concurrent work the downstream resource can take, and leave headroom for everything else that uses it: the API, reports, the nightly job. That number is your budget. Instances x concurrency has to fit inside it.
Then set both knobs:
| Platform | Per-instance concurrency | Instance cap |
|---|---|---|
| Azure Functions, Service Bus trigger | maxConcurrentCalls in host.json (default 16, multiplied by cores) |
functionAppScaleLimit (Consumption, Premium) or maximum instance count (Flex Consumption) |
| Azure Container Apps | your consumer's own setting | maxReplicas (default 10) |
| NServiceBus | LimitMessageProcessingConcurrencyTo (default: logical processors, minimum 2) |
whatever hosts the endpoint |
| MassTransit | ConcurrentMessageLimit, PrefetchCount (default max(CPU count x 2, 16)) |
whatever hosts the endpoint |
A few rules I follow:
How many consumers you run is a database decision that we keep making in the messaging layer, because that's where the slider lives. The queue will hold 40,000 messages for as long as you need. Your database won't hold an infinite number of concurrent transactions.
Go and multiply your instance cap by your per-instance concurrency. If you don't have an instance cap, that's your answer.
competing-consumers queue-based-load-leveling autoscaling azure-functions azure-service-bus nservicebus masstransit

Hi! Welcome to my blog
.NET, messaging, and distributed systems - the trade-offs the docs leave out.
Form not loading? Subscribe here.

